Hi
I have checked throughly for understanding how Req/s is being calculated in gatling graph.I observed there is a mismatch in calculation formula and graph.Here is the below example.Correct me if am wrong in understanding those results and any help on this wouldbe helpful for me.
Formula used to calculate:
((1 + 300) / 2 * 3 + 300 * 15) / (3 +15)
Formula ((1 + 300) / 2 * 3 + 300 * 15) / (3 +15) = 275.083333333
Graph Result = 272.311
In few cases which i have performed load test there is a bit high difference in between these two values(formula result and graph result)
Any information on this??
Does the calculation happens on Global request count or only with OK requests
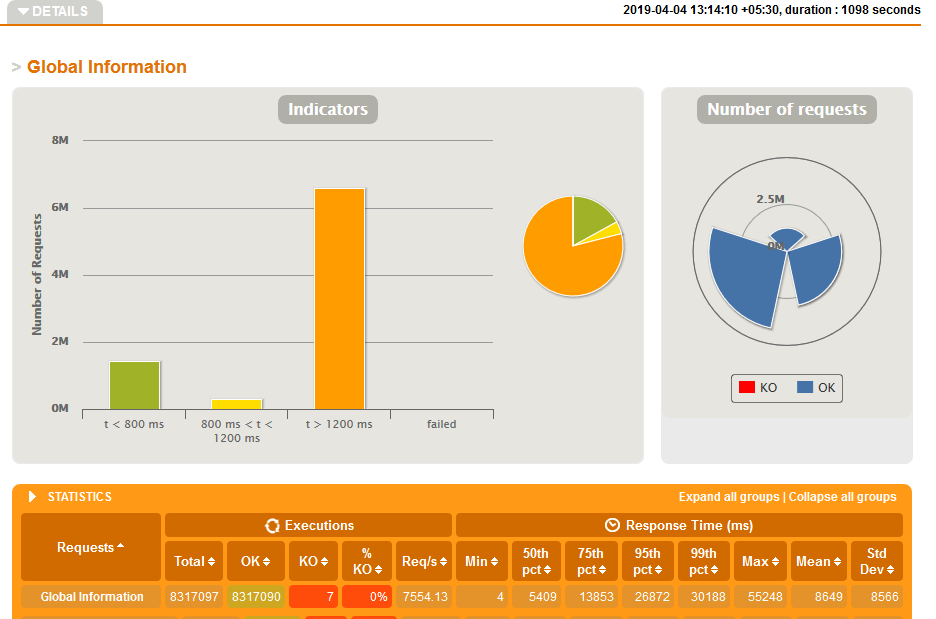
In failed test case scenario ,i do have below test result graph
8317097 requests/1098(total duration as per graph)=7574.769581056466
Graph Result= 7554.13
Could you provide your simulation.log, please?