I’m having some trouble understanding what the Number of Concurrent Users chart in Gatling actually represents. I’ve checked the documentation, but the explanation there is quite brief, and I couldn’t find any detailed resources elsewhere.
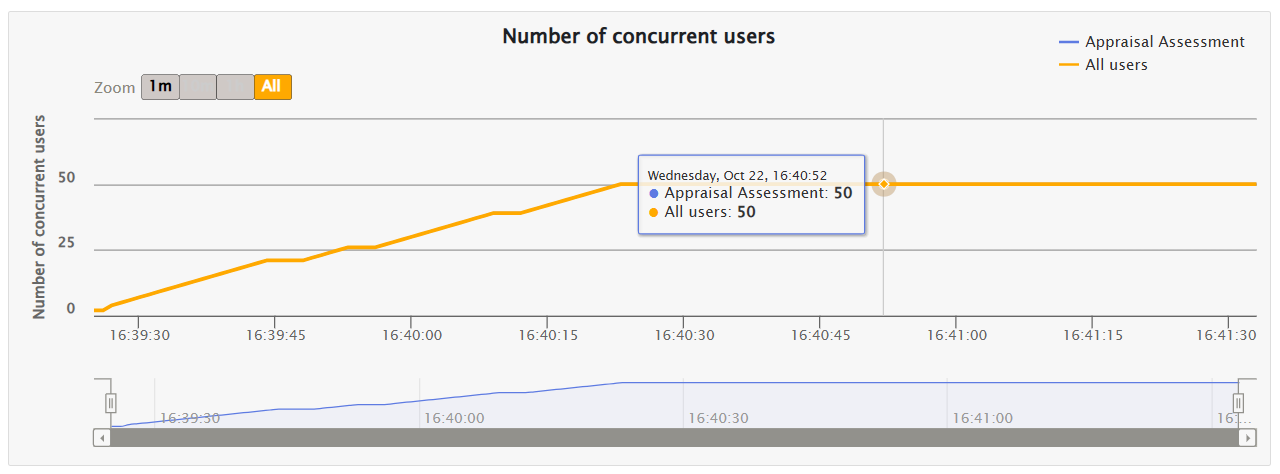
In my recent test run, the concurrent users chart looked a bit strange — it stays flat toward the end instead of gradually dropping off as the scenarios finish. I’ve included a snippet of my injection profile and a screenshot of the test results below for reference.
Any insights or clarifications would be greatly appreciated!
When posting in this category, you are presented with a template with a checklist so you can make sure you follow our prerequisites.
You have deleted this checklist instead of filling it.
In particular, you have deleted this one:
I made sure I’ve update my Gatling version to the latest release
I’m pretty sure this is your issue and you’re being bitten by a bug that’s already been fixed.