Hi Guys,
I’d just like to get some clarification on the graphs Gatling produces.
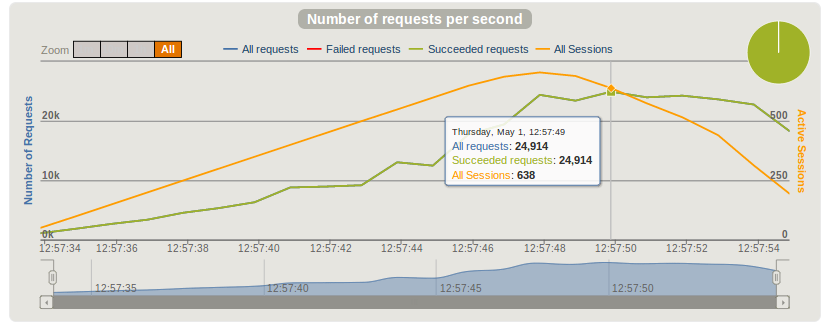
For example, on the Requests/sec graph, I see the details when you hover over the line… are these numbers successful requests in that second or cumulative?
I’m presuming that this is saying, at the time where the graphs cross there were 24914 requests in that second and 24914 were successful in that second… is that correct?
Cheers
Karl