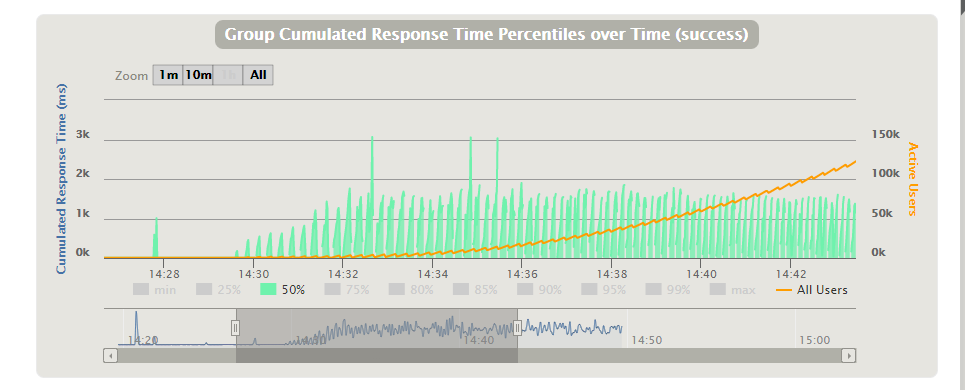
I have the following graph generated after making a load test with a high level number of users (going from 1 to 800 sessions per second). The problem is that at some points when I hover over the graph, there is no visible response time data. Is this a problem with Gatling, or maybe I have to set some specific config setting?
So you’re running 120k concurrent users??? What are you doing exactly?
You can also check Gatling’s GC activity with something like VisualVM or Yourkit. If you indeed have too much full GC, you should consider changing the GC option, e.g using G1 GC instead. Gatling’s current JVM options target JDK7 and G1 is better with JDK8. With G1, you trade 10% throughput for pauseless GC.
constantUsersPerSec(1) over (60),
constantUsersPerSec(30) over (60),
constantUsersPerSec(60) over (60),
constantUsersPerSec(90) over (60),
constantUsersPerSec(120) over (60),
.
.
.
constantUsersPerSec(840) over (60),
constantUsersPerSec(870) over (60),
Now, I am looking at the resource usage of the server and I am seeing that the CPU usage goes from 162% (I have 2 cores) and then stays for 10 seconds 0% and go back to 170%. I think that the problem is that I went for a huge load and the server is overloaded for those seconds and no requests are being closed served in those particular seconds so Gatling would have no data to display, right?