Dear friends
Now I’m learning about the setUp and I can’t understand some inject function.
so I want to see if I set different inject function ,Can I view the number of new active User every seconds?
the active User indicator in report is not totally fit the inject function.
Then about the Meta DSL I also have some question
for example
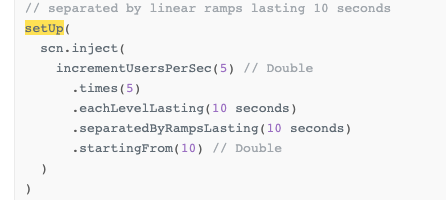
Can you explain this inject function means for me ? sorry I can’t understand the documentation.
Hello
this link has explanation with sample graphs-> https://gatling.io/2018/10/04/gatling-3-closed-workload-model-support/
Have a go through, if still couldn’t understand, will try to explain
Thanks
Sujin Sam
In this link, https://gatling.io/docs/current/general/reports/#active-users-over-time, you could see how the graph is plotted.
In order to understand this, one can use a .css .svg or .js request that takes less than 1sec to respond in the scenario. then use setup of constantConcurrentUsers(1) during (2 seconds) and we could see that the scenario has been executed multiple times in a second, say if it has executed 5times in a second.
so the graph will show 5 in 1st second and 5 in 2nd second , coz the 1 user which we sent to execute the scenario was active 5 times in a second.
say, if the user at the 5th iteration of 1st second was active till 1.2 seconds, then the graph will show 5 users in 1st second and 6 users in 2nd second
we can use this scenario setup and execute ourselves to understand better.
Thank you my friend , now I understand the Meta DSL
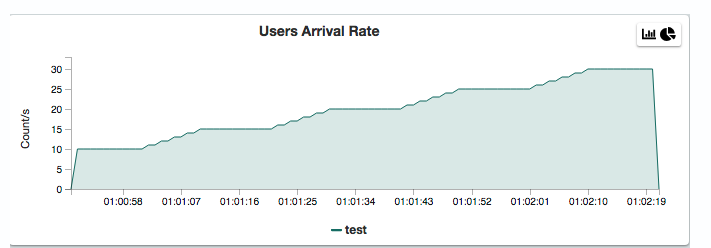
and I find the Users Arrival Rate is very helpful for me, Can I generate it when I run the simulations?
yeah, create a script and run the simulation with the injection pattern, you will achieve it
sorry, I have created a script and run the simulation with the injection pattern ,but in the report I can’t see the Users Arrival Rate chart.
This chart is from FrontLine, our enterprise product.
In Gatling OSS HTML reports, you have a different metric: active users. https://gatling.io/docs/current/general/reports/#active-users-over-time
Thank you , but in active-users chart, the active user = (number of alive users at previous second) + (number of users that were started during this second) - (number of users that were terminated during previous second),
Can I see number of users that were started during this second from report?
Looking forward your reply
I guess not, we cant be able to see number of users started at that moment