I have followed the docs for integrating grafana- influxdb- gatling for real time monitoring
In the groups i saw someone suggested to use this template to show the groups in grafana
“gatling.....count measurement.simulation.group.request.status.field”,
“gatling.....min measurement.simulation.group.request.status.field”,
“gatling.....max measurement.simulation.group.request.status.field”,
“gatling.....percentiles50 measurement.simulation.group.request.status.field”,
“gatling.....percentiles75 measurement.simulation.group.request.status.field”,
“gatling.....percentiles95 measurement.simulation.group.request.status.field”,
“gatling.....percentiles99 measurement.simulation.group.request.status.field”
And i was able to see the groups in grafana by this query
SELECT “percentiles95” FROM “gatling” WHERE “request” <> ‘allRequests’ AND $timeFilter GROUP BY “group”
This is the output i got
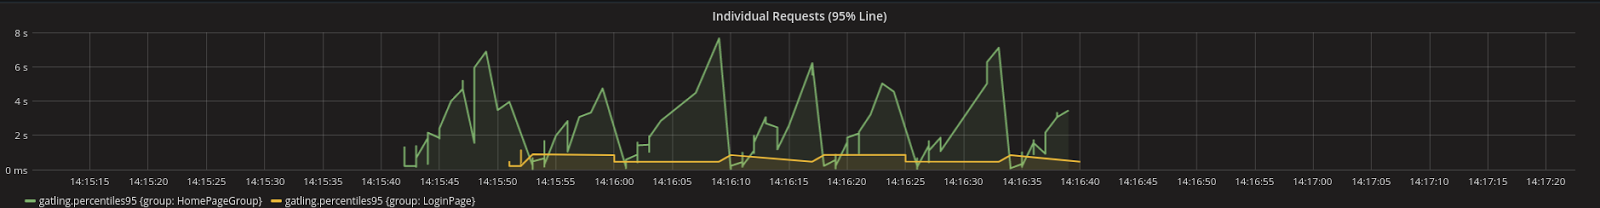
Ii need the clarification whether these points which are showing in a weird manner are actually the duration of that particular group at that time . There was one group request sent and why there are multiple points ?. Is the query wrong ? There should be one point after the completion of the group request. (which is the duration) or is it supposed to be like this . can anyone please answer ?