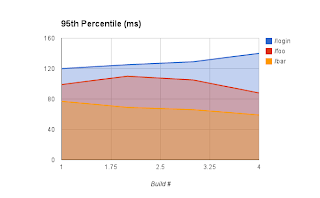
How to add per-http call metrics to the reports of Gatling's Jenkins plugin?

Gatling’s Jenkins plugin shows how the mean, the 95th percentile, and the % of KO requests changes between runs. What would I have to change to display per HTTP request metrics (see mockup below).

Looking at the source on github, GatlingProjectAction.java seems like a good starting point. It implements the get{Dashboard,MeanResponseTimeGraph,PercentileResponseTime}Graph methods. I am not sure though where those are called from and how I could add more data points into a given Graph.

  • How can I access the per-HTTP call metrics? I found that RequestReport contains Statistics instances. But each of those only contains 3 long values. SimulationReport.java seems to parse only global_stats.json. Do I have to parse another .json file to extract this data?

  • How would I hook up a new method in GatlingProjectAction like Graph<List> getGraph() with the rendering code? Which additional steps are needed to get a new graph showing up?

Thanks,
Ingo

I would suggest the following approach after looking at the source of Gatling and Gatling’s Jenkins plugin:

  1. Extend gatling so that it produces a stats.json file in addition to global_stats.json. Right now the per-request stats are only available in the Javascript file js/stats.json.

  2. Extend the gatling Jenkins plugin so that it optionally parses the stats.json file and adds the per-request trends to the graphs. Users of the plugin should be able to configure for which request name they want to see the trend over time.

What do you think about this approach?

I would appreciate any pointers about how to do #1. I have a pretty good understanding about how I can do #2. But I am still lacking the details on what I would have to change in Gatling to produce the stats.json file.

I created a issue/feature request on gatling for #1: https://github.com/gatling/gatling/issues/2482

Thanks,
Ingo