Gatling version: 3.11.3
Gatling flavor: java kotlin scala javascript typescript
Gatling build tool: maven gradle sbt bundle npm
I made sure I’ve update my Gatling version to the latest release
I read the guidelines and how to ask a question topics.
I provided a SSCCE (or at least, all information to help the community understand my topic)
I copied output I observe, and explain what I think should be.
Hi Gatling community ![]()
I’ve been load testing LLM APIs (OpenAI ChatGPT) using SSE streaming and discovered something interesting that I’d like to discuss with the experts here.
The Observation
When testing with the official example from the LLM API guide, I noticed a significant gap:
- Gatling P99 reported: 558ms
- User-experienced latency: 2,018ms (measured manually)
- Gap: +403% (1,460ms of streaming time NOT captured)
What I’m Measuring
Test setup:
- 610 concurrent requests to OpenAI GPT-3.5-turbo
- Using the official SSE example with
asLongAs()loop - Prompt categories: short, medium, long (30 different prompts)
Code structure (official example):
sse("Connect to LLM and get Answer")
  .post("/completions")
  .body(StringBody("{...}"))
  .asJson(),  // ← Timer stops here at HTTP 200 OK

asLongAs("#{stop.isUndefined()}").on(
  sse.processUnmatchedMessages((messages, session) ->
    messages.stream()
      .anyMatch(message -> message.message().contains("[DONE]"))
      ? session.set("stop", true) : session
  )
),  // ← This loop is NOT measured

sse("close").close()
My Understanding (Please Correct Me!)
From my analysis, I believe:
 Gatling is technically correct - It measures HTTP connection establishment
- This follows HTTP/SSE standards - Connection completes at HTTP 200 OK
 But user experience includes streaming - The
 asLongAs()loop processing is not captured in metrics
Timeline:
t=0ms     → POST request sent
t=558ms   → HTTP 200 OK received  ← Gatling timer stops
t=564ms   → First chunk received (TTFT)
t=2,018ms → [DONE] received       ← User sees complete response
The Question for the Community
Is this the expected behavior for SSE streaming in Gatling?
For LLM applications where the streaming phase (chunks 1-100) contains the actual value, should we:
- Accept that Gatling measures connection setup only (current)
- Implement manual timing for end-to-end latency (our workaround)
- Request a feature for optional end-to-end measurement?
Our Current Solution (Workaround)
We implemented manual timing inside the asLongAs() loop:
long requestStartTime = System.currentTimeMillis();
// ... process chunks ...
long responseTimeMs = System.currentTimeMillis() - requestStartTime;
// Export to custom JSONL for analysis
This works but:
 Loses Gatling’s built-in P99/P95 calculations
- Requires custom post-processing
- Not integrated with Gatling reports
Detailed Analysis Document
I’ve written a comprehensive analysis (15 pages) covering:
- Technical breakdown of SSE measurement in Gatling
- Code analysis of official example
- Comparison: Connection time vs End-to-end time
- Feature request proposal with API design
- Evidence with real test data (610 requests)
![]() Full document:
Full document: GATLING_FEATURE_REQUEST_ANALYSIS_EN.md
(Available in this repository) → load-test-llm-sse-gatling/docs/sprint1/experiments/gatling-sse-analysis-en.md at main · rcampos09/load-test-llm-sse-gatling · GitHub
Why This Matters
The official example names the request “Connect to LLM and get Answer” but only measures the “Connect” part. For teams defining SLAs or optimizing UX, this gap can lead to:
- Incorrect performance baselines
- Misdirected optimizations
- Misaligned expectations vs reality
Discussion Points
I’d love to hear from experienced Gatling users:
- Is my understanding correct? Am I missing something about how SSE timing works?
- How do you handle this? Do you use workarounds or accept connection-only metrics?
- Would a feature help? Something like
.measureUntilStreamCompletion().completionMarker("[DONE]") - Documentation clarity? Could the docs be clearer about what gets measured vs what gets “waited for”?
Test Environment
- Gatling: 3.11.3
- Java: 11
- Target: OpenAI API (GPT-3.5-turbo with streaming)
- Protocol: Server-Sent Events (SSE)
- Load: 610 concurrent requests (10 rampUsers, 10/sec constant)
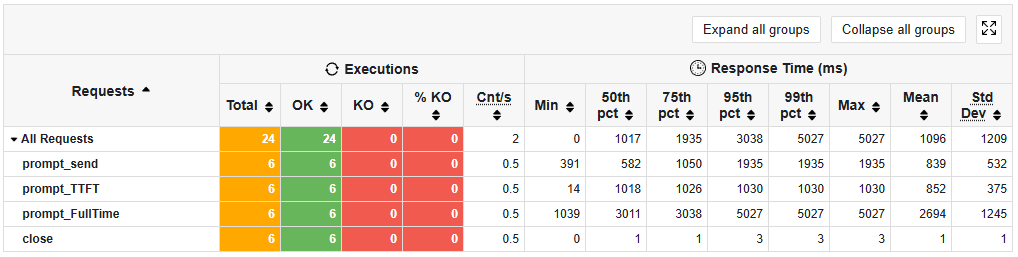
Real Test Results
Gatling Report:
---- Requests --------------------------------------------------------
> Connect to LLM - short    | P99: 558ms
> close                     | P99: 1ms
                            ← asLongAs loop NOT in report
Our Manual Measurements (exported to JSONL):
---- End-to-End Response Time ----------------------------------------
> Complete response (until [DONE])  | P99: 2,018ms
> TTFT (Time To First Token)        | P99: 6ms
> Streaming duration                | P99: 1,460ms
Gap Analysis:
- Gatling measures: 558ms (connection only)
- User experiences: 2,018ms (connection + streaming)
- Missing in metrics: 1,460ms (72% of total latency)
Evidence from Test Data
Distribution by prompt category:
| Category | Gatling P99 | Real End-to-End P99 | Gap |
|---|---|---|---|
| short | 558ms | 2,018ms | +261% |
| medium | 558ms | 9,700ms | +1,638% |
| long | 558ms | >10,000ms | +1,692% |
Key observation: Gatling P99 stays constant (~558ms) across all categories, but real user latency varies dramatically based on response length.
Proposed Feature (Optional Discussion)
If the community finds this useful, I’d suggest:
Option 1: Extend timer until stream completion
sse("Connect to LLM and get Answer")
  .post("/completions")
  .body(StringBody("{...}"))
  .measureUntilStreamCompletion()        // NEW
  .completionMarker("[DONE]")            // NEW
  .timeout(10, TimeUnit.SECONDS)         // NEW
  .asJson()
Option 2: Separate measurable request for streaming
scenario("Scenario").exec(
  sse("Connect to LLM")
    .post("/completions")
    .asJson(),

  sse("Process Stream")                  // NEW: Measurable
    .measureStreamDuration()
    .completionMarker("[DONE]")
    .asLongAs("#{stop.isUndefined()}").on(
      sse.processUnmatchedMessages(...)
    ),

  sse("close").close()
)
Benefits:
- Backward compatible (opt-in)
- Captures full user-perceived latency
- Integrated with Gatling’s P99/P95 calculations
- Aligned with growing LLM testing use case
I’m Open to Being Wrong!
I’m open to being completely wrong here - that’s why I’m asking the experts! If Gatling’s current behavior is the right approach for SSE streaming, I’d love to understand why.
Maybe there’s:
- A technical reason I’m not seeing
- A better way to structure the test
- A configuration I’m missing
- A fundamental misunderstanding on my part
Any guidance would be greatly appreciated! ![]()