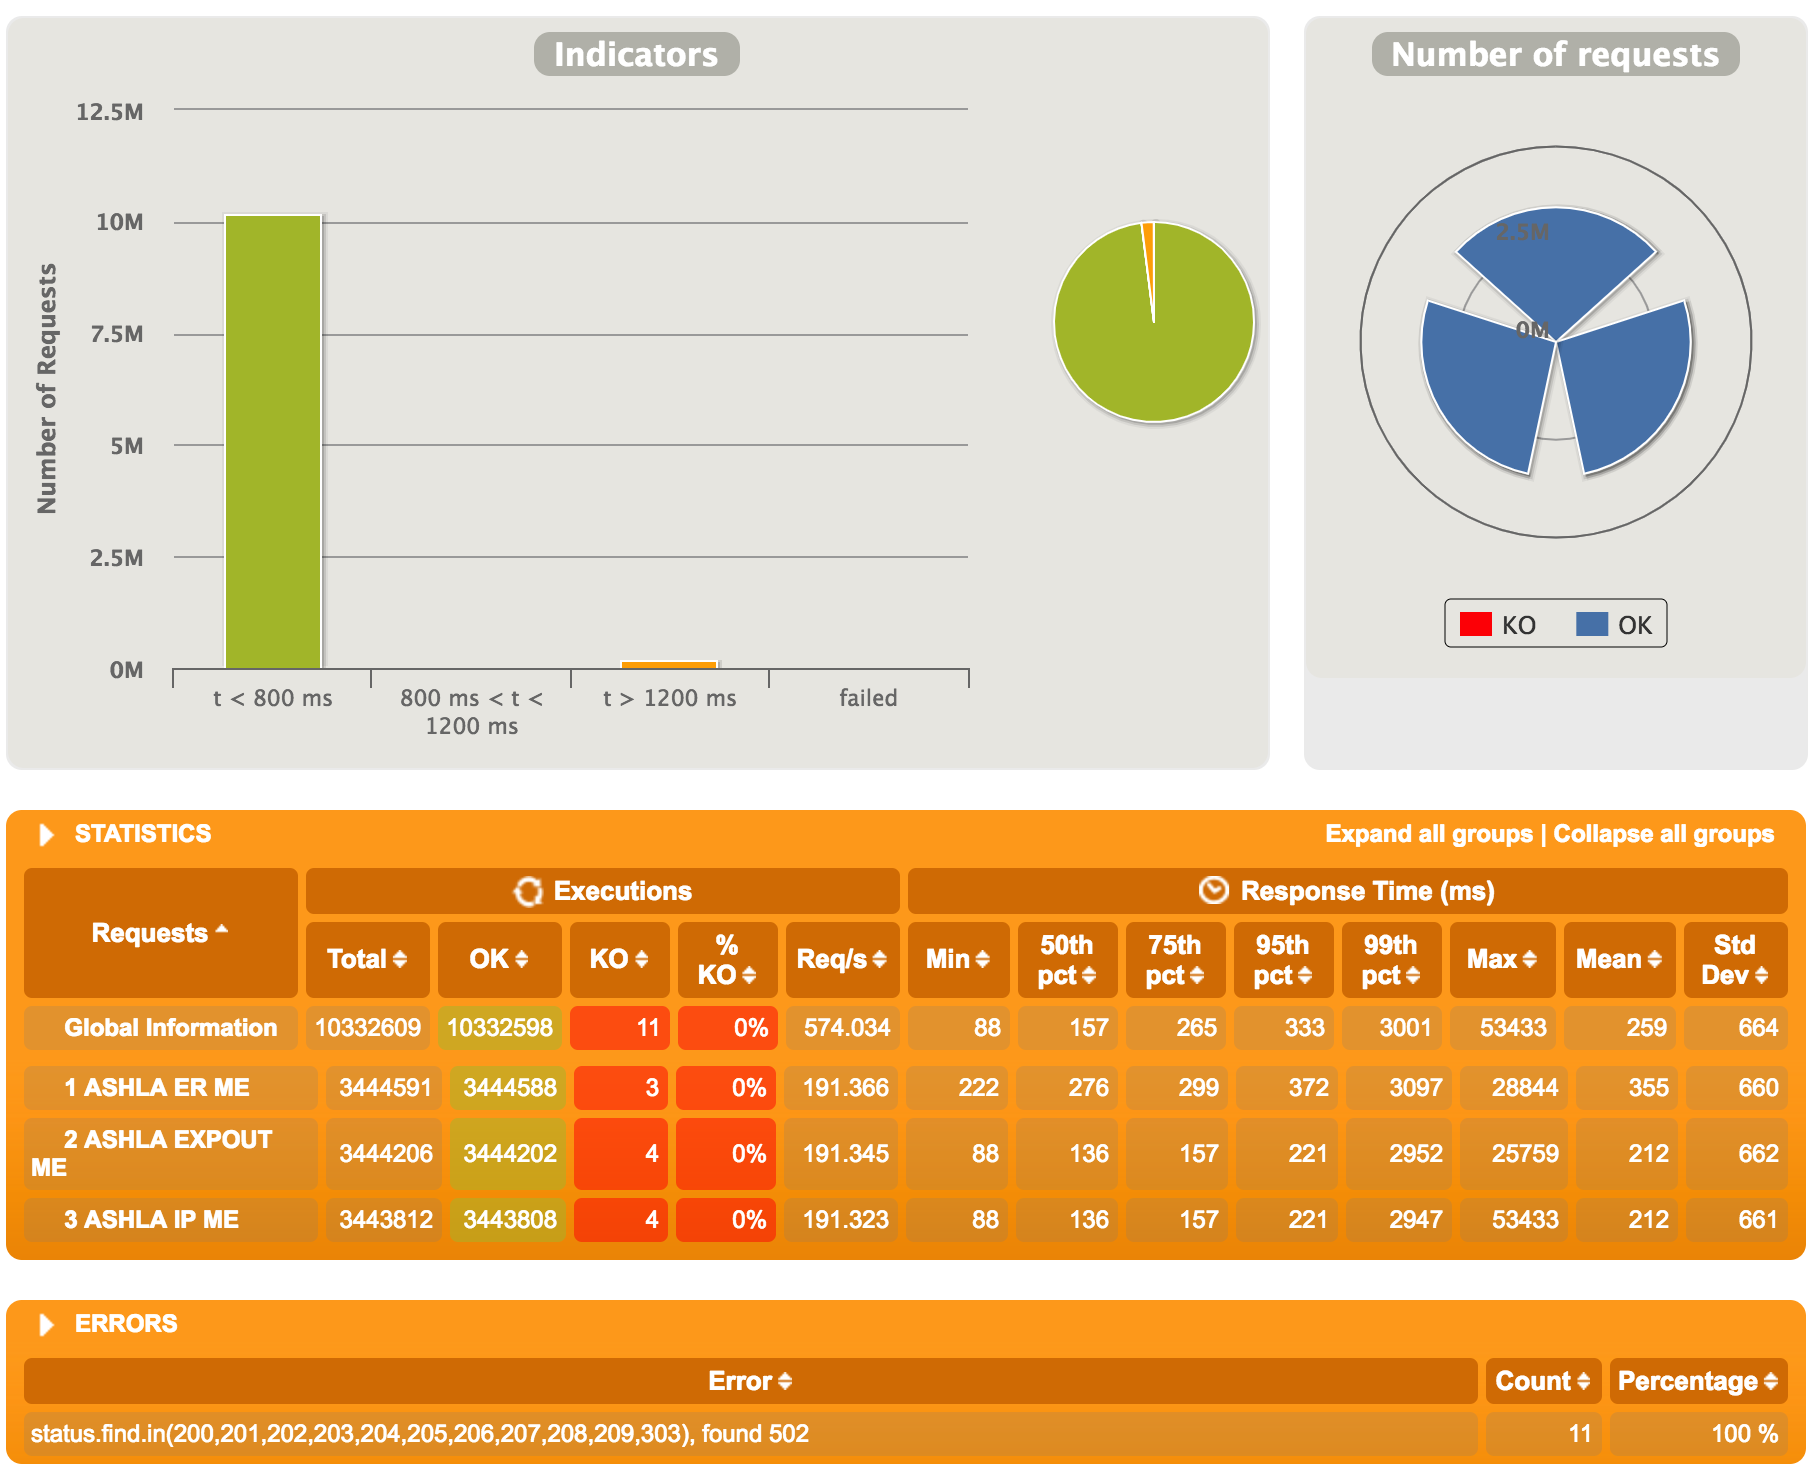
I am simulating a load of 1000 transactions per/sec in AWS on a ECS service. I see few 502 errors in the metrics logs and as seen in the screenshot gatling catches that too. But in the second graph attached, the response failure line shows 0 records throughout. How could this happen? Is this a bug?
I am using gatling 3.0.0-RC2
Thanks,
Preetam
You’re suing a release candidate (hence unstable) from several months ago.
Latest version is 3.0.3.
Have you tried upgrading before asking for help?
Have tried with 3.0.3 and I see the same issue. This is mostly at happening at scale where the reported number of failures do not match up in the response graph.
Yes have tried 3.0.3 and I see similar issue.
This chart displays events per second.
You had 11 errors on on a 5 hours run, which gives an average of 0.0006 rps.
Do you really expect to see those on the chart, all the more when compared to the +10M successful requests?