I’m trying to come up with a formula that in aggregate approximates the distribution of typical http response body sizes. I downloaded stats from the httparchive, and the graph looks like this (Note the logarithmic scales):
![]()
I don’t know what this distribution is called, so I don’t know what to search for to approximate it. Does anybody know the name of this distribution, or what kind of formula will approximate it?
I can’t see the image I’m sorry.
I can’t see the image I’m sorry.
DOH! The image got stripped. Let’s try again:
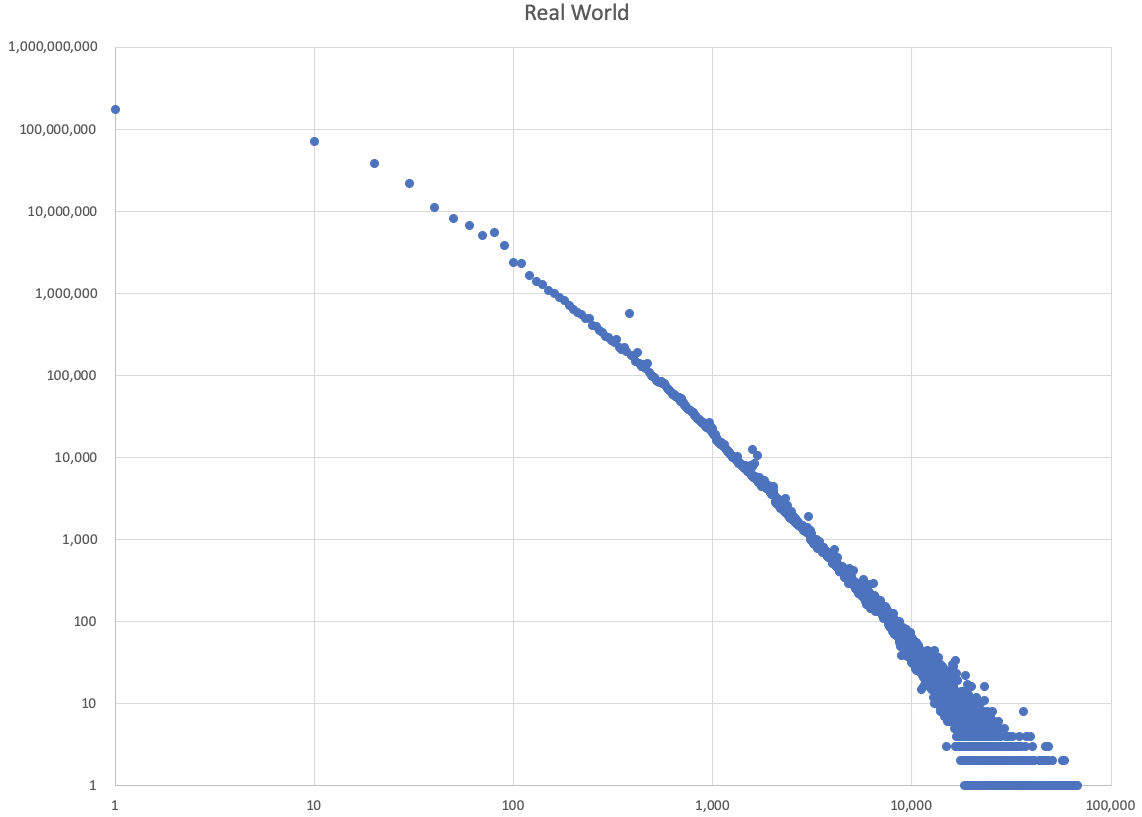
The horizontal (X-axis) is size of the page in kilobytes (rounded to multiples of 10). The vertical (Y-axis) is the number of responses at that size.
I’m testing a proxy server, so in order to test it under realistic load conditions, I need to have a realistic mix of payload sizes passing through it. I’ve built an endpoint that I can call and give it the size of the payload that I want back. Now I just need to compose a function that randomly picks a payload size. I’m trying to get the formula right so that a histogram of its output produces a graph that is a smoothed version of the above.
So far, I’ve been able to generate graphs with a straight line at the wrong angle (e.g. size = ( rand() ** 100 ) * ( upper - lower ) + lower), or that tend to be curved a little too much. The closest I have come so far is
size = ( ( -log(1-rand())/log(0.0000000001) ) ** e ) * ( upper - lower ) + lower
If anybody happens to recognize what kind of distribution produces this kind of histogram and can tell me the name so I can google it, I would be very grateful. 